3QFY2019 Result Update | Kitchen Appliances
January 29, 2019
TTK Prestige
Accumulate
CMP
`7,671
Performance Update
Target Price
`8,200
Y/E March (` cr)
Q3FY18
Q3FY19
YoY %
Q2FY19
QoQ%
Investment Period
12 Months
Net sales
458.0
552.0
20.5%
552.3
0.0%
EBITDA
66
85
28.3%
81
5.3%
Stock Info
EBITDA margin
14.5%
15.5%
14.7%
Sector
Kitchen Appliances
(%)
Adjusted PAT
43.7
56.8
30.2%
53.8
5.7%
Market Cap (` cr)
8,867
For Q3FY2019, TTK Prestige (TTK) posted decent performance with 20.5%/30%
Net Debt (` cr)
-
yoy growth in revenue/ PAT led by 100 bps expansion led by robust growth across
Beta
0.7
various product categories specially appliances and cookware.
52 Week High / Low
8100/5500
Revenue rose 7.2%: Q3’s top-line increase was also due to low base effect where
Avg. Daily Volume
2,489
last year, third quarter was little subdued after strong GST restocking happened in
Face Value (`)
10
Q2FY2018. Overall, cookers segment grew by 14% and appliances segment
BSE Sensex
35,593
grew by 29% yoy while cookware sales grew by 29% yoy. It sales is likely to
Nifty
10,652
remain buoyant driven by the strong new LPG connection under Ujjawala scheme
Reuters Code
TTKL.BO
and newly launched category like cleaning solutions and exports.
Bloomberg Code
TTKPT.IN
Margins improved by 100 bps: Its margin were the highest in the past at least 12
quarters at 15.5% due to better product mix, lower outsourcing and operating
Shareholding Pattern (%)
leverage. The company expects to maintain 14-15% margin profile on the back of
Promoters
70.4
improving product mix and distribution network.
MF / Banks / Indian Fls
9.6
Outlook and Valuation: We have maintained our earnings estimates in view of
FII / NRIs / OCBs
8.9
robust revenue outlook and stable operating margin in view of robust M9
Indian Public / Others
11.2
performance. We expect TTK to report a CAGR of~16%/23% in revenue/
earnings over FY18-20E. The stock is currently trading at 36x its FY2020
earnings. After our initiation in August 2018, the stock has given decent
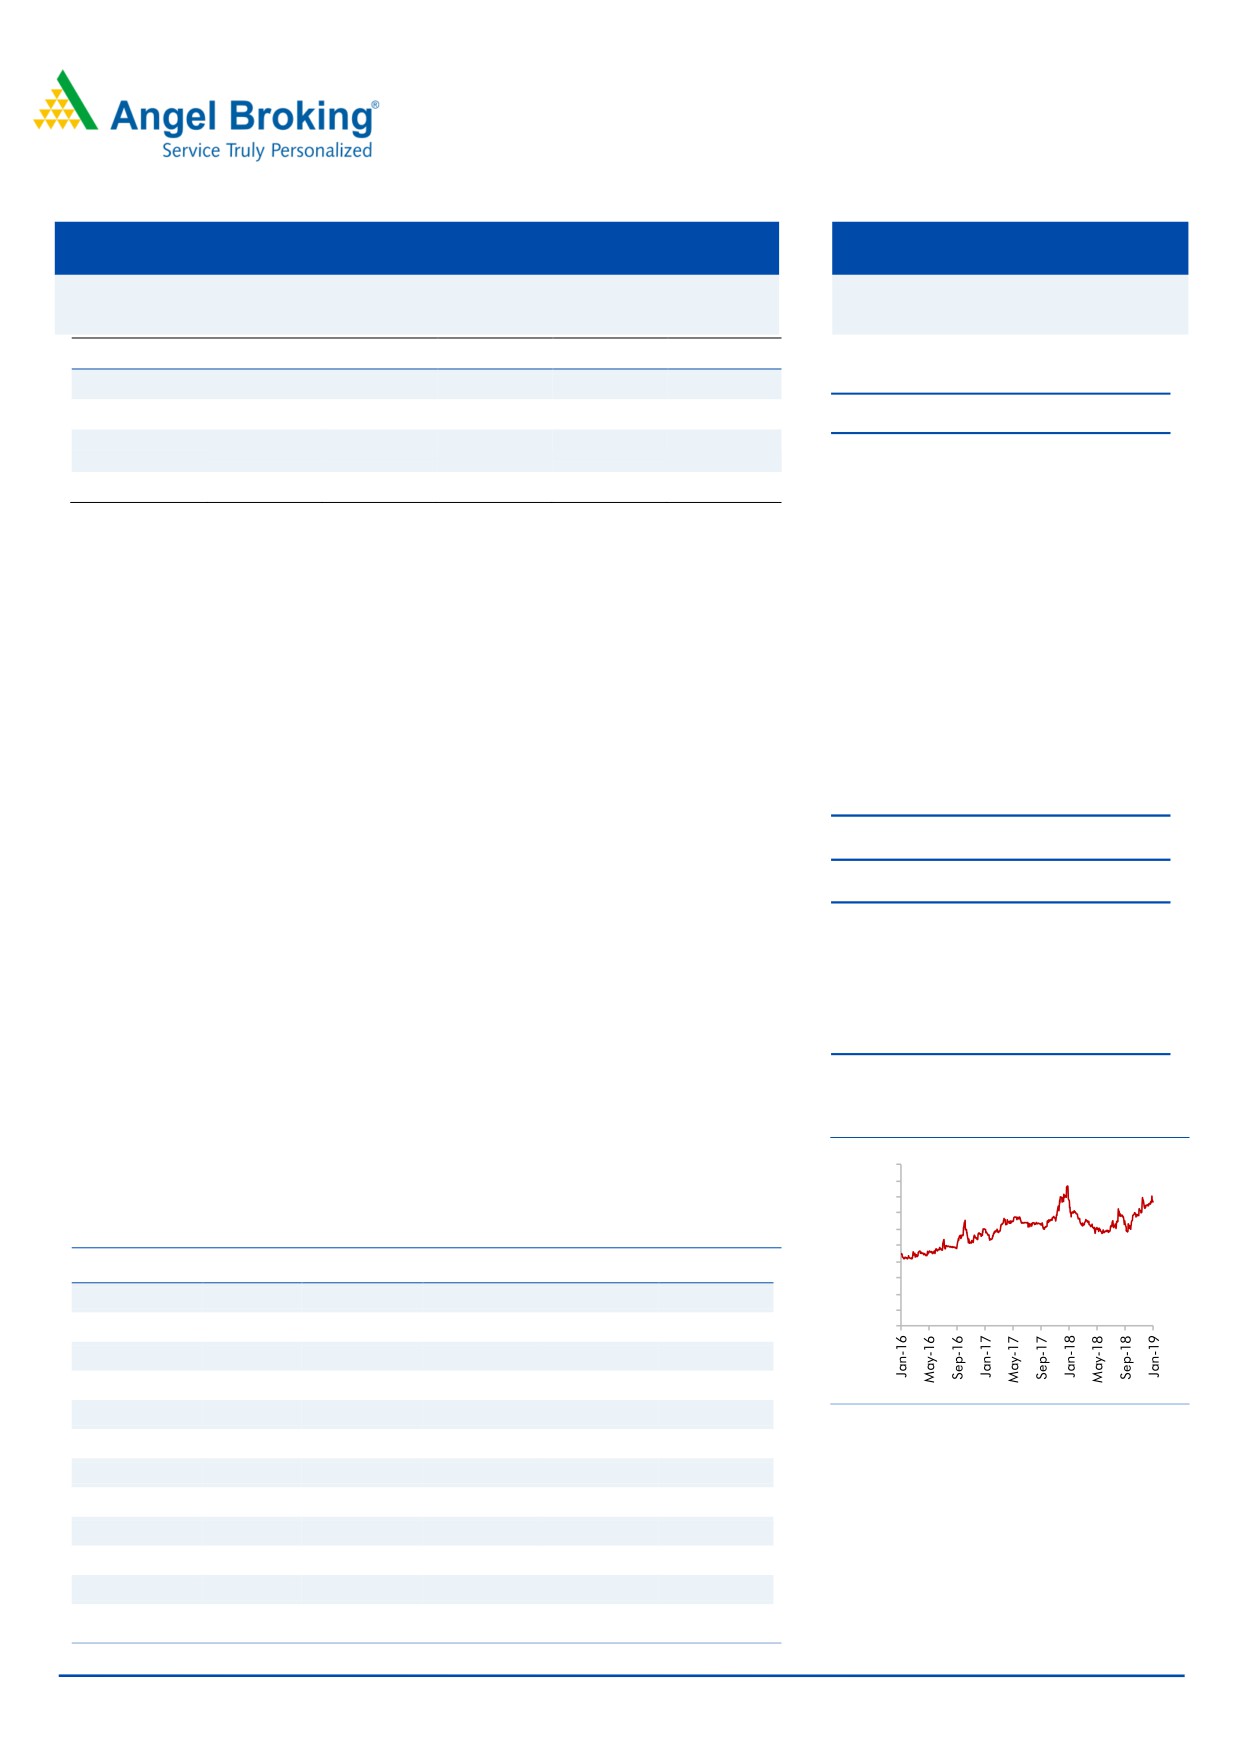
Price Chart
appreciation of 22% and now looks fairly valued. Hence, we maintain Accumulate
10,000
9,000
and target price of `8200 (38x FY2020E EPS).
8,000
7,000
6,000
Key Financials
5,000
4,000
Y/E March (` cr)
FY2016
FY2017
FY2018
FY2019E
FY2020E
3,000
2,000
Net Sales
1,559
1,837
1,982
2,254
2,649
1,000
% chg
12.3
17.8
7.9
13.8
17.5
0
Net Profit
115.6
150.7
164.5
205.5
247.1
% chg
25.2
30.3
9.2
24.9
20.3
OPM (%)
11.8
11.4
12.7
14.1
14.3
Source: Company, Angel Research
EPS (Rs)
100.0
130.3
142.3
177.8
213.8
P/E (x)
76.7
58.9
53.9
43.1
35.9
Nidhi Agrawal
P/BV (x)
9.4
7.9
6.6
5.7
4.9
022 - 3935 7800 Ext: 6872
RoE (%)
16.0
17.6
16.1
17.3
17.8
RoCE (%)
22.4
19.0
19.6
22.0
22.7
EV/Sales (x)
5.6
4.8
4.4
3.8
3.2
EV/EBITDA (x)
47.9
42.1
34.7
27.2
22.7
Source: Company, Angel Research
Please refer to important disclosures at the end of this report
1
TTK Prestige |3QFY2019 Result Update
Exhibit 1: Q3FY2019 Performance
In ` Cr
Q3FY18
Q2FY19
Q3FY19
YOY Growth QoQ growth
M9FY18
M9FY19
YOY
Total Income
458
552
552
20.5%
0.0%
1330
1523
14.5%
Total Expenditure
392
471
467
19.2%
-1.0%
1,153
1,301
12.9%
Raw Material Consumed
100
125
129
29.3%
2.8%
299
368
23.2%
Stock Adjustment
-31
18
-49
57.9%
-378.1%
7
-35 -615.0%
Purchase of Finished Goods
193
176
235
21.6%
33.1%
466
540
16.0%
COGS
262
319
315
20.3%
-1.3%
771
873
13.2%
Employee Expenses
34
40
44
30.0%
9.9%
98
122
24.4%
Other Expenses
95
112
107
12.5%
-3.9%
284
306
8.0%
Total Expenditure
392
471
467
19.2%
-1.0%
1153
1301
12.9%
EBITDA
66.5
81.0
85.3
28.3%
5.3%
177.0
221.7
25.3%
Other Income
3.7
6.4
6.6
80.8%
2.5%
136.8
17.7
-87.0%
Interest
0.5
0.7
0.5
15.2%
-19.7%
1.4
1.5
7.1%
PBDT
69.7
86.8
91.4
31.2%
5.3%
312.4
238.0
-23.8%
Depreciation
6.2
6.5
6.5
5.3%
0.2%
18.6
19.3
3.8%
PBT
63.5
80.3
84.9
33.7%
5.7%
293.9
218.7
-25.6%
Tax
19.8
26.5
28.0
41.4%
5.8%
74.4
72.2
-2.9%
Reported Profit After Tax
43.7
53.8
56.8
28.4%
5.7%
219.5
146.5
-33.2%
Extra-ordinary Items
102.2
Adjusted PAT
43.7
53.8
56.8
28.4%
5.7%
117.3
146.5
24.9%
Ratios
EBITDA margin (%)
14.5%
14.7%
15.5%
13.3%
14.6%
PAT margin %
9.5%
9.7%
10.3%
16.5%
9.6%
Tax rate %
31.2%
33.0%
33.0%
25.3%
33.0%
Source: Company, Angel Research
Risks to our estimates
Abrupt fluctuations in its primary raw materials- Aluminum and steel whose prices
are linked to global commodity prices. Although the company has been able to
pass on the increase in raw material prices to consumers in the past owing to a
strong brand, any failure to do so in the future can adversely impact operating
margins.
Foreign exchange movement- The company imports raw materials and finished
goods from outside India as well as makes export sales to countries outside the
territories in which they operate from which exposes it to foreign currency risk.
Foreign currency exchange risks are managed by entering into forward contracts
against foreign currency vendor payables.
Excessive competition/ pricing war - TTK is competing with many different players
in different category. Many foreign players are also entering Indian markets which
could lead aggressive competition, pricing war. So far, TTK has gained market
share from its competition over the years with its innovative culture and growth
strategies.
January 29, 2019
2
TTK Prestige |3QFY2019 Result Update
Profit & Loss Statement
Y/E March (` cr)
FY2016
FY2017
FY2018
FY2019E FY2020E
Total operating income
1,559
1,837
1,982
2,254
2,649
% chg
12.3
17.8
7.9
13.8
17.5
Total Expenditure
1,376
1,627
1,731
1,936
2,271
Raw Material
931
1,085
1,124
1,274
1,492
Personnel
114
138
159
176
207
Selling and Administration Expenses
313.8
374.0
421.0
462.1
543.0
Others Expenses
17
31
27
25
29
EBITDA
183
210
251
318
378
% chg
20.0
14.5
19.5
26.8
18.9
(% of Net Sales)
11.8
11.4
12.7
14.1
14.3
Depreciation& Amortisation
21
26
26
28
32
EBIT
162
184
225
290
346
% chg
21.4
13.4
22.3
28.6
19.3
(% of Net Sales)
10.4
10.0
11.4
12.8
13.0
Interest & other Charges
6
11
7
7
7
Other Income
10
11
141
20
25
(% of PBT)
6.2
5.9
39.4
6.6
6.9
Share in profit of Associates
-
-
-
-
-
Recurring PBT
167
184
359
302
363
% chg
25.1
10.2
95.3
(15.8)
20.3
Tax
51
33
96
97
116
(% of PBT)
30.7
18.1
26.6
32.0
32.0
PAT (reported)
116
151
263
206
247
Extraordinary Items
-
-
99
-
-
Less: Minority interest (MI)
0
0
0
0
0
PAT after MI (reported)
115
150
263
205
247
ADJ. PAT
116
151
165
206
247
% chg
25.2
30.3
9.2
24.9
20.3
(% of Net Sales)
7.4
8.2
8.3
9.1
9.3
Fully Diluted EPS (Rs)
100.0
130.3
142.3
177.8
213.8
% chg
25.2
30.3
9.2
24.9
20.3
January 29, 2019
3
TTK Prestige |3QFY2019 Result Update
Consolidated Balance Sheet
Y/E March (` cr)
FY2016
FY2017
FY2018
FY2019
FY2020
SOURCES OF FUNDS
Equity Share Capital
12
12
12
12
12
Reserves& Surplus
711
842
1,008
1,175
1,381
Shareholders Funds
723
854
1,020
1,187
1,392
Equity Share Warrants
-
-
-
-
-
Total Loans
-
113
129
129
129
Deferred Tax Liability
-
-
-
-
-
Other liabilties
6.8
6.3
5.4
5.4
5.4
Total Liabilities
730
973
1,154
1,322
1,527
APPLICATION OF FUNDS
Gross Block
351
567
598
688
778
Less: Acc. Depreciation
21
58
108
137
169
Net Block
330
510
490
552
609
Capital Work-in-Progress
3
2
4
4
4
Investments
68
75
167
167
167
Current Assets
583
680
880
1,035
1,256
Inventories
325
380
437
497
584
Sundry Debtors
175
215
258
294
345
Cash
31
65
136
188
261
Loans & Advances
52
20
49
56
66
Other Assets
-
-
-
-
-
Current liabilities
238
281
373
423
496
Net Current Assets
346
400
507
612
761
Deferred Tax Asset
(29)
(35)
(42)
(42)
(42)
Total Assets
730
973
1,154
1,322
1,527
January 29, 2019
4
TTK Prestige |3QFY2019 Result Update
Cash Flow Statement
Y/E March (` cr)
FY2016
FY2017
FY2018
FY2019
FY2020
Profit before tax
167
184
359
302
363
Depreciation
21
26
26
28
32
Change in Working Capital
(64)
(70)
(47)
(53)
(76)
Interest / Dividend (Net)
9
(0)
(6)
7
3
Direct taxes paid
(36)
(37)
(93)
(97)
(116)
Others
(19)
(9)
(112)
1
5
Cash Flow from Operations
78
94
127
188
211
(Inc.)/ Dec. in Fixed Assets
(17)
(26)
(12)
(90)
(90)
(Inc.)/ Dec. in Investments
11
(142)
9
20
25
Cash Flow from Investing
(6)
(168)
(3)
(70)
(65)
Issue of Equity
0
0
0
0
0
Inc./(Dec.) in loans
0
113
0
0
0
Dividend Paid (Incl. Tax)
0
0
0
0
0
Interest / Dividend (Net)
(2)
(8)
(75)
39
(31)
Cash Flow from Financing
(71)
106
(113)
0
(73)
Inc./(Dec.) in Cash
2
31
11
119
73
Opening Cash balances
25
27
58
69
188
Closing Cash balances
27
58
69
188
261
Source: Angel Research, Company
January 29, 2019
5
TTK Prestige |3QFY2019 Result Update
Key Ratios
Y/E March
FY2016
FY2017
FY2018
FY2019
FY2020
Valuation Ratio (x)
P/E (on FDEPS)
76.7
58.9
53.9
43.1
35.9
P/CEPS
49.5
38.3
23.4
28.9
24.2
P/BV
9.4
7.9
6.6
5.7
4.9
Dividend yield (%)
0.3
0.4
0.4
0.4
0.5
EV/Sales
5.6
4.8
4.4
3.8
3.2
EV/EBITDA
47.9
42.1
34.7
27.2
22.7
EV / Total Assets
12.0
9.1
7.5
6.5
5.6
Per Share Data (`)
EPS (Basic)
100.0
130.3
142.3
177.8
213.8
EPS (fully diluted)
100.0
130.3
142.3
177.8
213.8
Cash EPS
118.1
152.6
250.1
202.2
241.7
DPS
22.0
27.0
30.0
33.0
36.3
Book Value
625.5
738.4
882.1
1,026.9
1,204.4
Dupont Analysis
EBIT margin
10.4
10.0
11.4
12.8
13.0
Tax retention ratio
0.7
0.8
0.7
0.7
0.7
Asset turnover (x)
2.5
2.2
2.3
2.3
2.4
ROIC (Post-tax)
18.0
18.2
19.5
20.5
21.5
Cost of Debt (Post Tax)
0.0
0.1
0.0
0.0
0.0
Returns (%)
ROCE
22.4
19.0
19.6
22.0
22.7
Angel ROIC (Pre-tax)
26.0
22.3
26.6
30.1
31.6
ROE
16.0
17.6
16.1
17.3
17.8
Turnover ratios (x)
Asset Turnover (Gross Block)
4.4
3.2
3.3
3.3
3.4
Inventory / Sales (days)
76
75
81
81
81
Receivables (days)
41
43
48
48
48
Payables (days)
93
94
121
121
121
Working capital cycle (ex-cash)
(days)
24
24
7
7
7
Source: Company, Angel Research
January 29, 2019
6
TTK Prestige |3QFY2019 Result Update
Research Team Tel: 022 - 39357800
DISCLAIMER:
Angel Broking Limited (hereinafter referred to as “Angel”) is a registered Member of National Stock Exchange of India Limited, Bombay
Stock Exchange Limited, Metropolitan Stock Exchange Limited, Multi Commodity Exchange of India Ltd and National Commodity &
Derivatives Exchange Ltd It is also registered as a Depository Participant with CDSL and Portfolio Manager and Investment Adviser with
SEBI. It also has registration with AMFI as a Mutual Fund Distributor. Angel Broking Limited is a registered entity with SEBI for Research
Analyst in terms of SEBI (Research Analyst) Regulations, 2014 vide registration number INH000000164. Angel or its associates has not
been debarred/ suspended by SEBI or any other regulatory authority for accessing /dealing in securities Market. Angel or its
associates/analyst has not received any compensation / managed or co-managed public offering of securities of the company covered
by Analyst during the past twelve months.
This document is solely for the personal information of the recipient, and must not be singularly used as the basis of any investment
decision. Nothing in this document should be construed as investment or financial advice. Each recipient of this document should make
such investigations as they deem necessary to arrive at an independent evaluation of an investment in the securities of the companies
referred to in this document (including the merits and risks involved), and should consult their own advisors to determine the merits and
risks of such an investment.
Reports based on technical and derivative analysis center on studying charts of a stock's price movement, outstanding positions and
trading volume, as opposed to focusing on a company's fundamentals and, as such, may not match with a report on a company's
fundamentals. Investors are advised to refer the Fundamental and Technical Research Reports available on our website to evaluate the
contrary view, if any
The information in this document has been printed on the basis of publicly available information, internal data and other reliable
sources believed to be true, but we do not represent that it is accurate or complete and it should not be relied on as such, as this
document is for general guidance only. Angel Broking Limited or any of its affiliates/ group companies shall not be in any way
responsible for any loss or damage that may arise to any person from any inadvertent error in the information contained in this report.
Angel Broking Limited has not independently verified all the information contained within this document. Accordingly, we cannot testify,
nor make any representation or warranty, express or implied, to the accuracy, contents or data contained within this document. While
Angel Broking Limited endeavors to update on a reasonable basis the information discussed in this material, there may be regulatory,
compliance, or other reasons that prevent us from doing so.
This document is being supplied to you solely for your information, and its contents, information or data may not be reproduced,
redistributed or passed on, directly or indirectly.
Neither Angel Broking Limited, nor its directors, employees or affiliates shall be liable for any loss or damage that may arise from or in
connection with the use of this information.
Disclosure of Interest Statement
TTK Prestige
1. Financial interest of research analyst or Angel or his Associate or his relative
No
2. Ownership of 1% or more of the stock by research analyst or Angel or associates or
No
relatives
3. Served as an officer, director or employee of the company covered under Research
No
4. Broking relationship with company covered under Research
No
Ratings (Based on Expected Returns:
Buy (> 15%)
Accumulate (5% to 15%)
Neutral (-5 to 5%)
over 12 months investment period)
Reduce (-5% to -15%)
Sell (< -15%)
January 29, 2019
7